Mind the gap
25.05.13

As inequality gets worse, Governments need to ensure appropriate safety nets are in place so that those faced with the greatest economic difficulties are not left wanting when it comes to healthcare.
At the risk of stating the obvious, the economic downturn since 2008 has made a lot of people poorer. We frequently hear about the European debt crisis but, of course, the real economic catastrophe is unemployment. Chart 1 shows how the percentage rate of unemployment has got worse throughout Europe, particularly in the South, with Greece and Spain reaching an eye-watering 27%. According to Eurostat, this is not a trend that is showing signs of reversal any time soon.
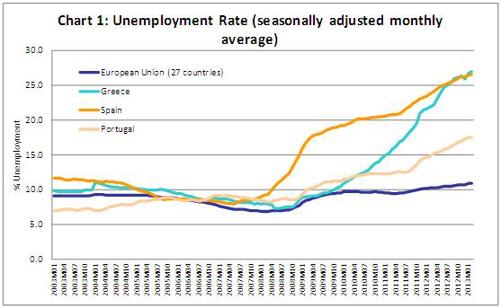
Source: Eurostat
The OECD has recently provided a more in-depth analysis of how the situation – which of course extends beyond the EU – has affected inequality and poverty. It’s not a happy story. Before taking account of any attempt that welfare systems make to off-set the effects of recession, the OECD demonstrates that inequality has increased more in the 3 years before 2010 than it did in the preceding 12 years.
Across the OECD, the gap between rich and poor has been widening for some time. Chart 2 shows how the Gini Coefficient – the most common measure of inequality – has evolved since 1980. An increase in the Gini Coefficient means a less equal distribution of income.
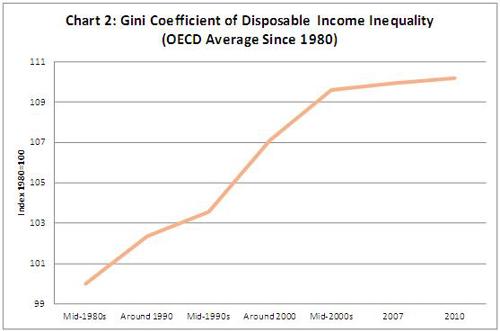
Source: Base de données de l’OCDE sur la distribution des revenus
Looking at the differences between 2007 and 2010, the OECD goes on to explain how households with lower incomes, proportionally, lost more income in periods of decline and gained less in periods of recovery (to the extent there has been any recovery) compared with richer households. In comparing the richest 10% with the poorest 10% of society, the analysis shows that the richest did proportionally better in 21 of the OECD’s 33 member countries.
What does it mean for healthcare?
European welfare systems, through tax and benefits, are able to some extent to compensate those who lose out. Indeed the OECD suggested this is the case across most of its member countries. Healthcare is, however, not observed specifically, which is a shame, as I think it’s worth considering carefully.
As Governments around Europe have sought to meet their public deficit targets, spending on healthcare has come under scrutiny. In fact it’s come under more than scrutiny – some would say it’s come under the knife in a number of countries. But alongside what the Government spends on healthcare, it’s important not to forget that in most countries, individuals are asked to pay their share too. If people become poorer then it gets tougher to fund even a modest share of the bill. It’s important to understand the implications of this. Chart 3 shows how the proportion of so-called out-of-pocket expenditure in healthcare varies across Europe.
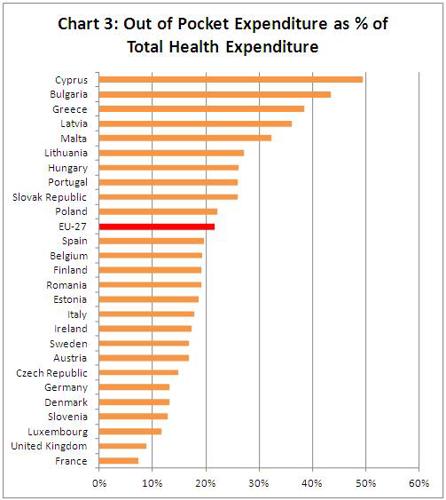
Source: OECD Health Data 2012 (2012); WHO Global Health Expenditure Database (accessed 2013).
The variation in levels of out-of-pocket expenditure is perhaps, though, not what we might expect. Generally speaking in poorer countries people are asked to fund a higher proportion of their healthcare bill from their own pockets as Chart 4 shows.
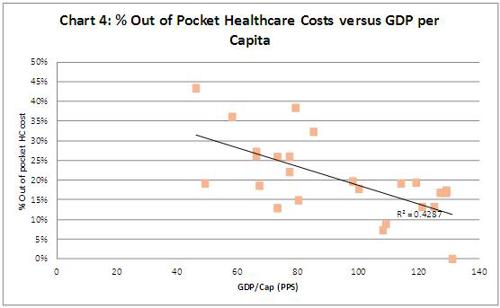
Source: OECD Health Data 2012 (2012); WHO Global Health Expenditure Database (accessed 2013), Eurostat
Aside from the fact that the quality of care in the poorer countries of Europe is not what it is in the richer countries (a topic for a future blog post), it stands to reason that if the poorest in society are hit hardest by the crisis, then funding even a share of the healthcare is going to become more difficult than it was before.
So what has happened to out-of pocket expenditure across Europe during the crisis? Well, on average – as we can see if Chart 5 – it’s come down slightly since 2008, but only slightly. The real story is that, on average European citizens per head were paying 135% more in 2011 than they were in 1995. That’s the trend that should give us pause for thought.
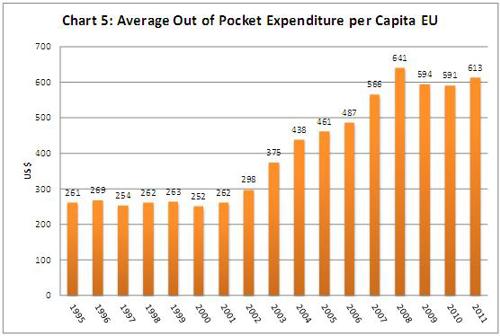
Source: WHO (World Health Organisation): National Health Accounts Database (accessed 2013).
Out of pocket costs (or co-pays) can be important tool for healthcare systems. They can help prevent ‘over consumption’ and, if structured the right way, can encourage consumption of an efficient mix of treatment. For example co-pay structure can encourage the use of cheaper medicines, where appropriate, which is important as it helps keep public spending under control and ensures that payers see the benefits of cheaper older medicines, releasing funds that can be spent on newer, more innovative therapies where needed. It starts to become more questionable, though, if out of pocket costs start to look more like an alternative source of funding for healthcare. If alternative funding is needed then we need a proper, long-term debate on how to achieve it. If patients on the wrong end of the income distribution are asked to pay more at a time when paying for life’s basics has become tougher than ever, then we run the risk of making a bad situation worse.
