Showing data about arrow_drop_down
Update
- The pharma industry - R&D
- The pharma industry in figures - Economy
- The pharma industry in figures - Employment
- The pharma industry in figures - Healthcare
- Value to patients
- Value to healthcare systems
- Value to the economy
- Value to society
- Medicines cost in context
- Innovation
- Pharmaceutical R&D expenditure in Europe, USA and Japan
- R&D process
- R&D in Europe
- Allocation of R&D investments
- New chemical or biological entities
- Estimated costs of bringing a new entity to market
- Pharmaceutical R&D expenditure - Annual growth rate (%)
- R&D intensity
- Impact on the European economy
- Geographical breakdown of sales of new medicines
- R&D expenditure in Europe, USA and Japan
- Parallel imports
- Production
- World pharmaceutical market
- Market value
- VAT rates
- Generics
- Imports and exports
- Trade balance (by country)
- Trade balance - high technology sectors
- EU main pharmaceutical trading partners
- Employment in the pharmaceutical industry (by country)
- Employment in the pharmaceutical industry (by year)
- Employment in pharmaceutical R&D
- Total spending on healthcare
- Payment for pharmaceuticals
- Causes of death by major disease areas
- Breakdown of health expenditure
- New medicines
- Cancer mortality
- Life expectancy
- Hep C - cure rates
- Chronic diseases - impact
- Vaccines - impact
- HIV - death rates
- Health gains and savings
- The added value of medicines
- Industry contribution to European economy
- Innovative treatments
- Ageing population
- Chronic disease
- New medicines

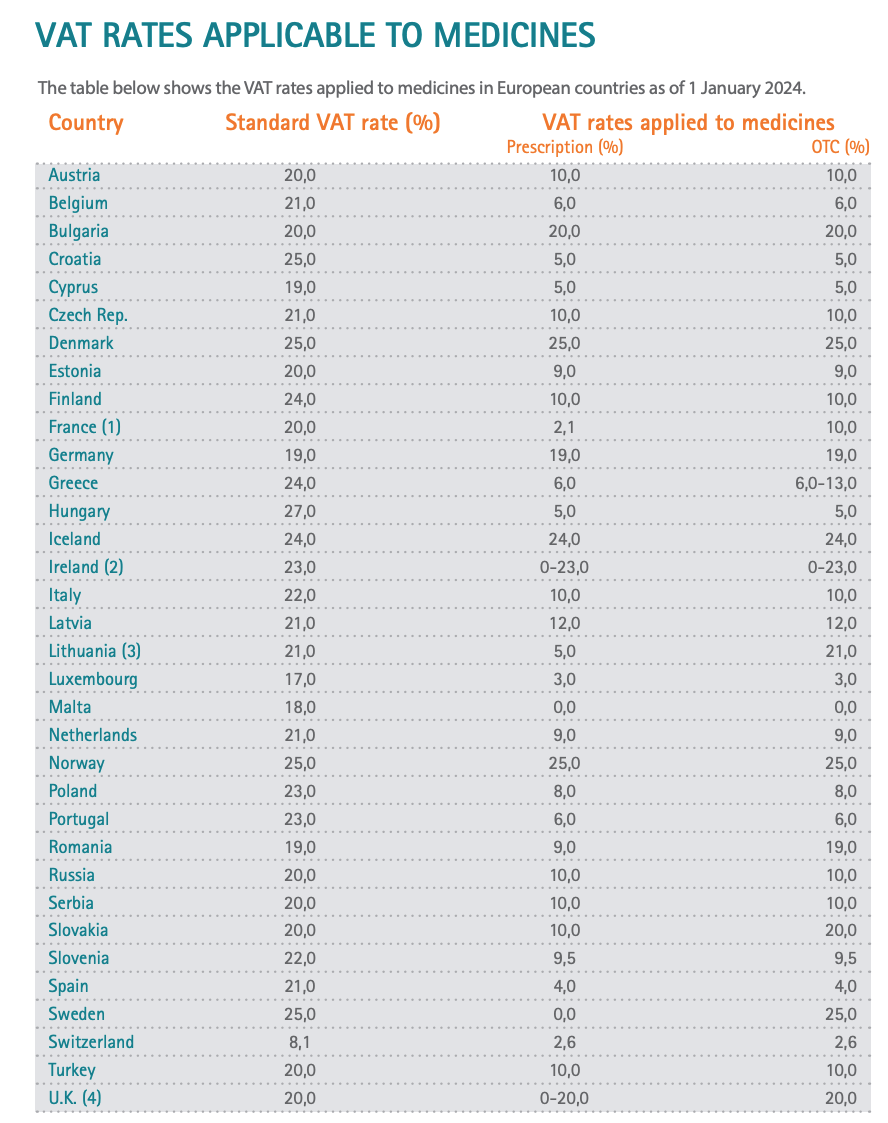
(1) France: reimbursable medicines 2.1%; non-reimbursable medicines 10.0% (2) Ireland: oral medication 0%; other medication 23% (3) Lithuania: reimbursable medicines 5.0%; non-reimbursable medicines 21.0% (4) U.K.: 0% for prescription medicines dispensed in the Community; 20% for prescription medicines consumed in the hospital setting